How ML Prevents Hospital Readmissions: A Proven Predictive Analytics Guide
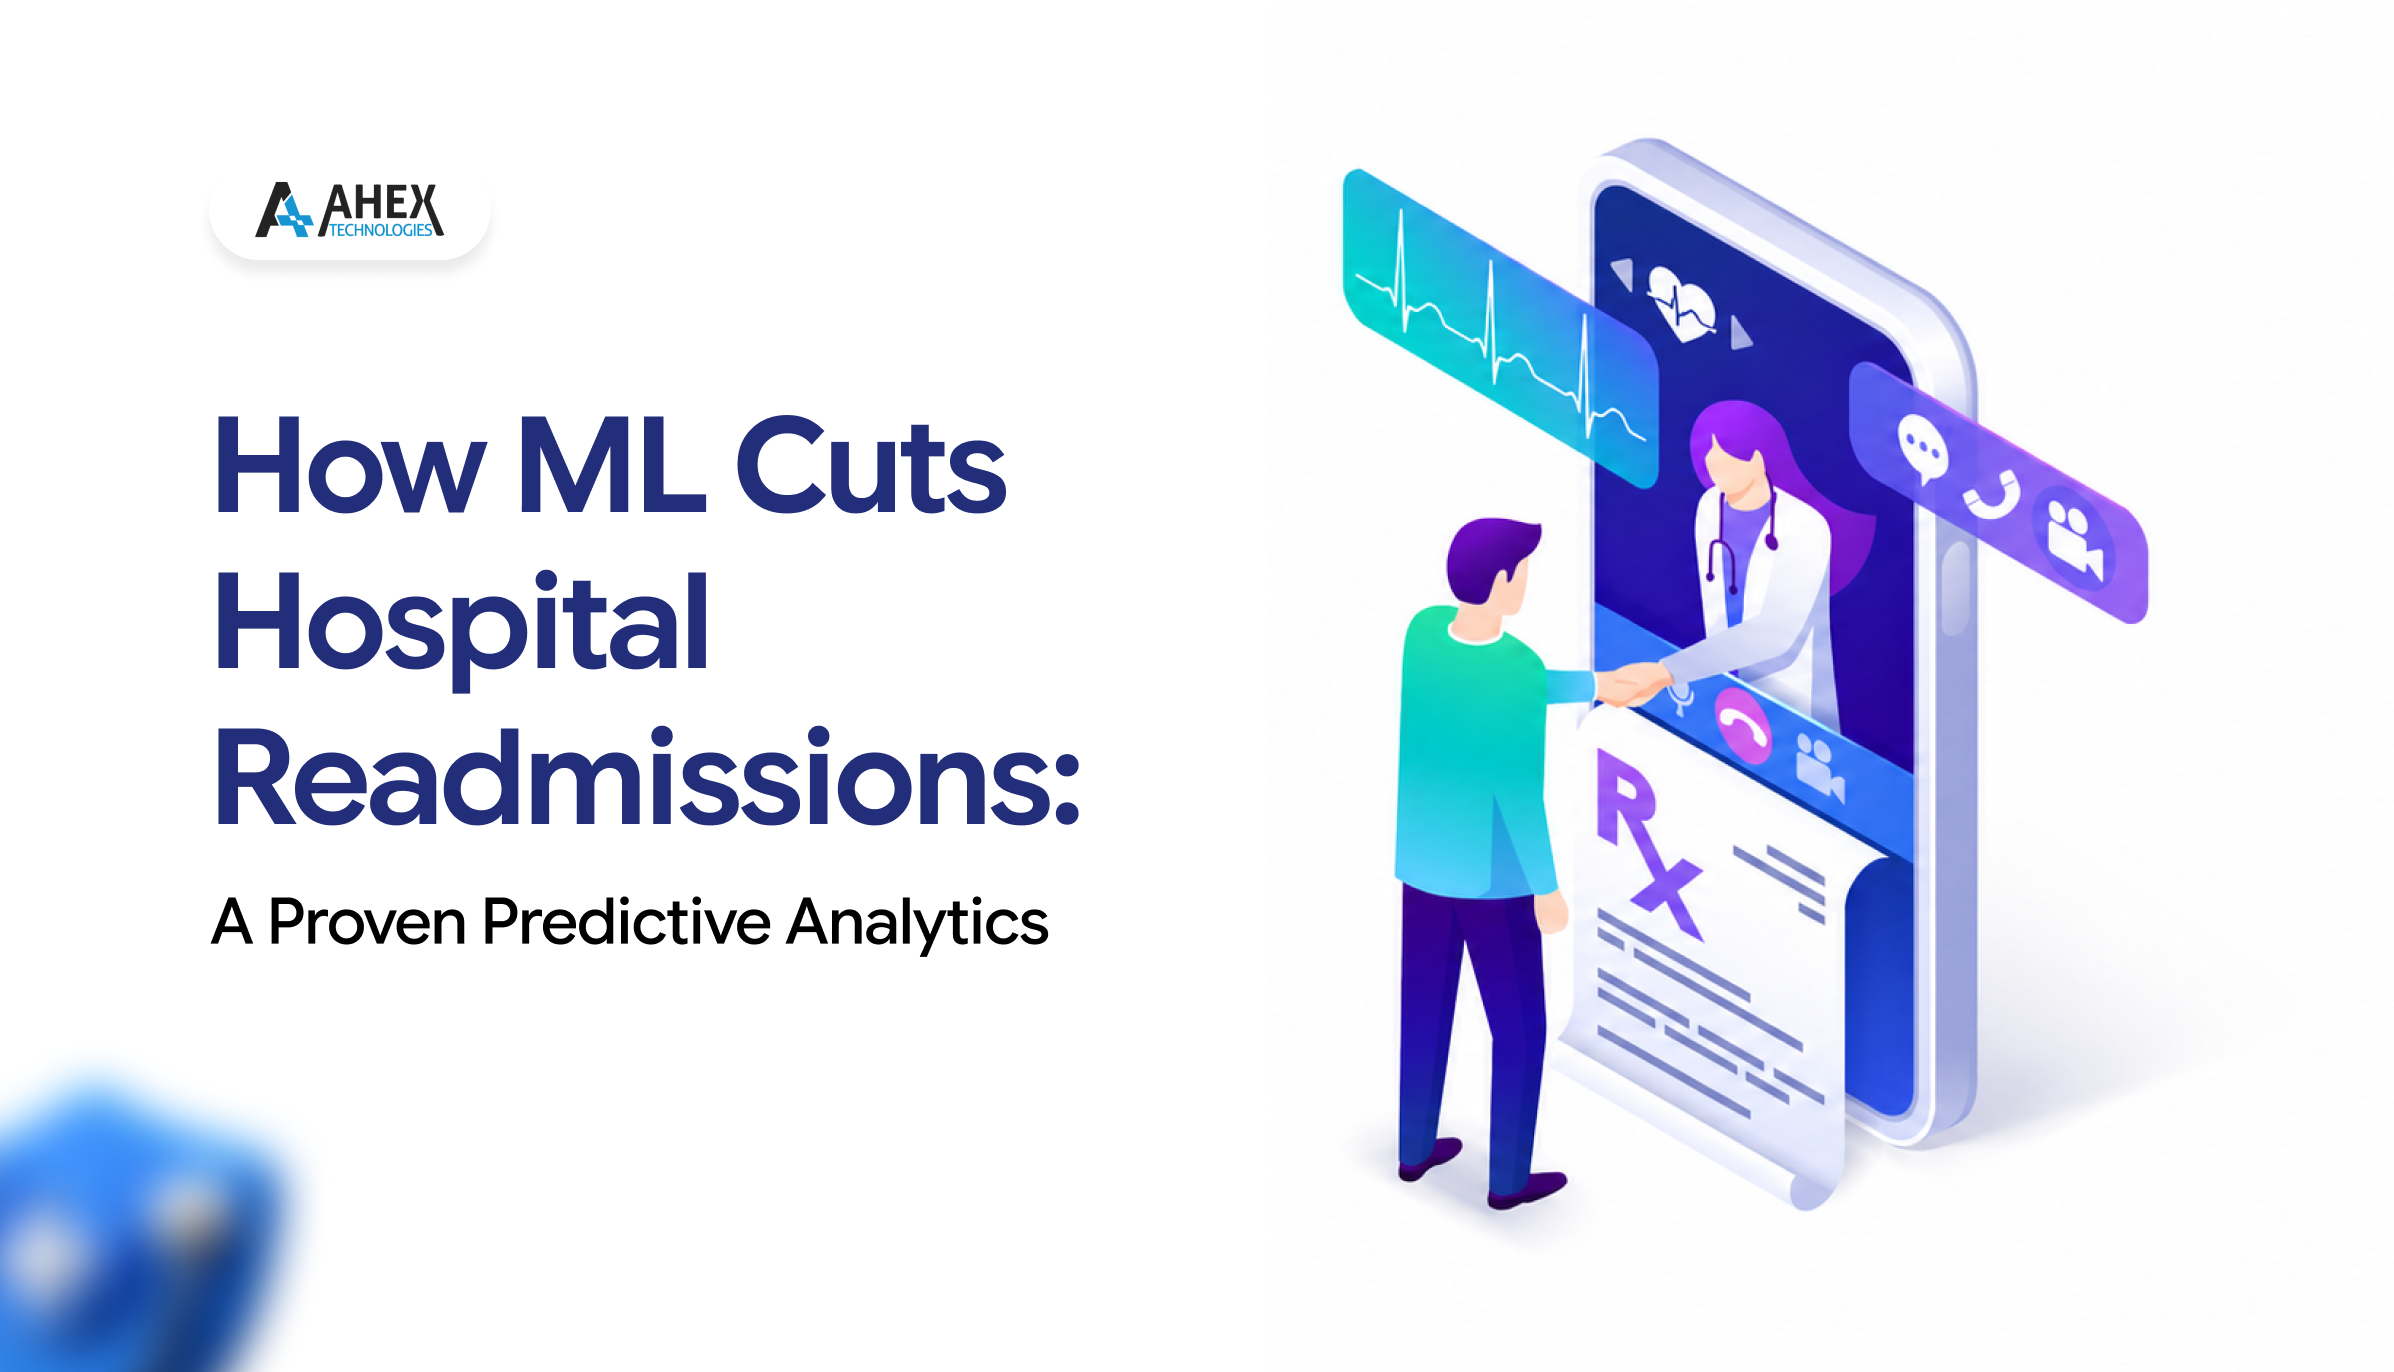
Let’s talk about a number that keeps hospital administrators awake at night: $26 billion.
That is how much the U.S. healthcare system bleeds every single year due to patients returning to the hospital within 30 days of being discharged. Often, these readmissions are for conditions that were entirely preventable. To make matters worse, the Centers for Medicare & Medicaid Services (CMS) now directly penalizes hospitals for high readmission rates. In 2024 alone, over 2,200 hospitals were hit with financial penalties totaling more than $500 million.
But here is the truly frustrating part: most of these readmissions aren’t surprises.
Imagine a patient with heart failure. They have a complicated medication list, no reliable family support at home, and they’ve already visited the ER three times this year. Everyone on the clinical team knows this patient is highly likely to come back. The discharge planner suspects it. Yet, without a systematic way to flag and act on that risk, the patient is sent home with a stack of confusing papers and a follow-up appointment they probably won’t be able to keep.
This is exactly where machine learning (ML) shifts from a buzzword to a lifesaver. We aren’t talking about vague “AI will cure everything” promises. We’re talking about a highly specific, well-trained model that looks at patient data at the time of discharge and ranks them by their likelihood of returning within 30 days. That simple ranking allows care teams to prioritize who gets a follow-up phone call, who gets a home visit, and who needs extra help picking up their prescriptions.
In this guide, we’re going to walk through the entire pipeline of building one of these systems, from figuring out which features actually matter, to training on the MIMIC-III dataset, explaining the model’s choices to doctors using SHAP, and finally deploying a real-time scoring API.
1. Why Do Patients Really Come Back?
Before we can predict readmissions, we have to understand the human elements behind them. Readmissions aren’t just random bad luck. While the most common medical reasons are heart failure, pneumonia, COPD, and heart attacks, the actual drivers are usually social and logistical.
Why do they come back? Maybe they couldn’t afford their new medications. Maybe their follow-up appointment was scheduled three weeks out, and their health deteriorated in week two. Maybe they live alone, and no one noticed the early warning signs.
If your model only looks at lab values and ignores the patient’s living situation, it will constantly underestimate the risk for patients who look medically stable on paper but are walking into a home environment that guarantees a relapse.
2. Key Predictive Features: What Actually Matters
Feature selection is where a lot of well-meaning data science teams stumble. The temptation is to throw every single data point from the Electronic Health Record (EHR) into the model and let the algorithm sort it out. While that sometimes works, understanding which features carry real signals makes your model much more reliable and—crucially—easier to explain to doctors.
Demographics and Social Features
Age is naturally a strong predictor, but don’t overlook insurance status. Insurance is a massive proxy for access to follow-up care. Patients relying on Medicaid or those without insurance face huge structural barriers to outpatient care. Zip codes, when paired with census data, can also tell your model a lot about a patient’s access to fresh food, housing stability, and average income.
Admission and Discharge Characteristics
How a patient arrived matters. Emergency room admissions inherently carry a higher readmission risk than planned surgeries. The length of stay is tricky; it has a U-shaped relationship with risk. Very short stays might mean the patient was rushed out the door prematurely, while very long stays indicate severe complications. Finally, where they go after discharge—home alone, home with a nurse, a skilled nursing facility, or hospice—completely changes their risk profile.
Clinical Data: Diagnoses, Procedures, and Labs
A patient’s primary diagnosis is a massive clue, but comorbidities (having multiple conditions at once) are the real smoking guns. A heart failure patient who also battles depression, diabetes, and kidney disease is at a vastly higher risk than someone with isolated heart failure.
When it comes to labs, the strongest signals usually come from:
● Sodium levels at discharge
● BUN/creatinine ratio
● Hemoglobin
● Blood glucose
If these values are abnormal right as the patient is walking out the door, it’s a giant red flag that they are leaving while still medically unstable.
Utilization History
Past behavior predicts future behavior. How many times was this patient hospitalized in the last 12 months? How many ER visits? Do they even have a primary care doctor? A patient with four hospitalizations last year requires a totally different level of care than a first-time patient.
3. Choosing the Right ML Model: Random Forest, XGBoost, or LSTM?
There are three main model families you’ll see used in readmission prediction. The right choice really depends on the shape of your data and what your clinical IT team can handle. For a deeper look at how these model families interact with modern generative approaches, this piece on the synergy between machine learning and generative AI is worth a read.
Random Forest: The Reliable Workhorse
Random Forest is essentially a massive committee of decision trees voting on an outcome. It handles mixed data types beautifully, doesn’t throw a fit if there are missing values, and requires minimal preprocessing. Best of all? It’s incredibly easy to explain to clinicians. Typical AUROC: 0.72–0.76.
XGBoost: The Tabular Heavy Hitter
When your data is structured in clean rows and columns (like most EHR data), XGBoost is almost always the champion. It builds trees sequentially, where each new tree tries to fix the mistakes of the previous one. Because readmissions are a relatively rare event (happening in about 15–20% of cases), XGBoost’s ability to handle class imbalance makes it a top-tier choice. Typical AUROC: 0.76–0.82.
LSTM: When Time is the Main Character
Long Short-Term Memory (LSTM) networks are deep learning models designed for sequences. If you have rich, time-series data—like a patient’s vitals mapped out hour-by-hour over a 10-day stay—an LSTM can spot trends that tree-based models are blind to. A creatinine level that is slowly but steadily climbing over five days tells a very different story than a single, isolated high reading. The downside? They are resource-heavy, require massive datasets, and are tough to interpret. Typical AUROC: 0.78–0.85.
4. Feature Engineering for Clinical Data
If you’ve ever looked at raw EHR data, you know it’s incredibly messy. Transforming that chaos into clean, model-ready features is where the real magic happens.
Handling Missing Lab Values
In healthcare data, a missing lab value isn’t just an empty cell; it’s a clinical decision. If a doctor didn’t order a potassium test, it usually means the patient looked stable enough not to need one. Because of this, we create two columns: one for the actual lab value, and a binary column (1 or 0) indicating whether the lab was measured at all.
Time-Based Aggregations
For patients with multiple lab readings, capturing the trend is vital. We calculate the minimum, maximum, and slope of their labs. A sodium level that dropped from 140 to 134 is very different from one that rose from 128 to 134, even though both patients are leaving the hospital with a reading of 134.
By mathematically mapping these values—like checking if a lab was measured, finding its peak during the stay, and calculating the slope of its change—and combining them with weighted comorbidity indices, we translate raw clinical history into powerful predictive signals.
5. Training on the MIMIC-III Dataset
If you want to build a healthcare model, MIMIC-III (Medical Information Mart for Intensive Care) is your playground. It contains beautifully detailed clinical data from over 40,000 ICU patients. It is the absolute best place to build, test, and validate a readmission model before you try touching your own hospital’s proprietary data.
Setting up a robust training pipeline for this data involves carefully handling class imbalances (since only ~15% of patients are readmitted) and using stratified cross-validation to ensure our model learns effectively without being overwhelmed by negative cases.
A quick tip: Why use both AUROC and AUPRC metrics when evaluating your model? For imbalanced problems, AUROC can be highly deceptive. A model that just lazily guesses “not readmitted” for everyone will look great on an AUROC curve but will be useless clinically. AUPRC (Area Under the Precision-Recall Curve) forces the model to prove it can actually find the rare positive cases.
Temporal Validation: A Critical Step People Skip
Standard cross-validation randomly shuffles patients across folds. For clinical ML, this is a dangerous data leak. It lets “future” data bleed into your training set, inflating performance metrics. In the real world, your model trains on past patients and predicts on future ones. Always use temporal validation: train on patients admitted before a certain date, and test on patients admitted after. If your performance nosedives, you’ve got data leakage or a fragile model.
6. SHAP Values: Getting Clinicians to Trust You
Getting a model into a clinical workflow requires trust. When a nurse practitioner sees a red “High Risk” banner next to a patient’s name, their immediate question is: “Why?”
“The XGBoost model said so” is not an acceptable answer. They need to hear: “This patient has three prior hospitalizations this year, left with an abnormal sodium level, and has no home support.” This is where SHAP (SHapley Additive exPlanations) steps in. It breaks down the math and assigns a specific weight to every single feature, showing exactly how much that feature pushed the patient’s risk score up or down.
By presenting this data directly in the dashboard, care coordinators can immediately understand the context. That output tells a story: the patient is going home alone with low sodium and a history of frequent visits, but they don’t even have home health set up. That is an actionable insight! Building these kinds of explainable, human-centered AI systems is a core part of what we do as an AI-enabled application development partner.
7. Serving It Up: The Real-Time Scoring API
A model sitting in a Jupyter notebook saves zero lives. To make an impact, your risk score needs to pop up during the discharge planning workflow—usually 24–48 hours before the patient goes home.
This requires a fast, reliable API that grabs the patient’s data from the EHR (via HL7 FHIR or a direct database query), engineers the features, runs the model, computes the SHAP explanations, and spits out a JSON response. The whole round trip should feel instantaneous (under 500 milliseconds).
8. Integration: Winning Over the Care Team
The technology is actually only 50% of the battle. The other 50% is human behavior. If nobody changes their workflow to use your model, the project will fail. It’s not because the model is bad, but because the workflow wasn’t adapted around it.
Where to Surface the Score
The discharge planning process is your golden window of intervention. Most hospitals have a structured discharge planning workflow that triggers 24–48 hours before the patient actually leaves. That is when social workers, case managers, and nurses are already huddling over the post-discharge plan.
A common, fatal mistake is putting this score in the physician’s note-taking view. Physicians are rarely the ones calling patients post-discharge, scheduling home visits, or arranging medical transport. Put the tool in the case management system—exactly where the care coordinators already spend their day.
Alert Fatigue: The Real Enemy
If your model flags 40% of the hospital as “High Risk,” the staff will succumb to alert fatigue and stop looking at it within two weeks. Your goal isn’t to flag everyone who might return; it’s to help a stretched-thin care team prioritize their limited capacity. Design for operational capacity: if your care team can actively intervene with 10 patients a day, the model should confidently hand them the 10 patients who need them most urgently. This same principle of designing AI around real human workflows applies across industries see how it plays out in AI across customer care, digital labor, and IT operations.
Closing the Feedback Loop
Model performance drifts over time. Patient demographics shift, new care practices emerge, and EHR data pipelines evolve. You absolutely must set up a monitoring system that tracks prediction accuracy monthly. Set up a database table that logs every prediction, waits 30 days to record the actual outcome, and maps it against the model version. Review this quarterly, and retrain when drift is detected. A model deployed flawlessly in 2025 could be flying blind by mid-2026 without maintenance.
9. ROI & Outcomes: Did It Actually Work?
Let’s talk about what success looks like in both financial and clinical terms.
Calculating Your Financial ROI
The math here is incredibly straightforward. On average, a single readmission costs a hospital approximately $15,000 (factoring in direct costs and CMS penalties).
Let’s say a hospital has 10,000 discharges a year with a 15% readmission rate. That’s 1,500 readmissions annually. A well-implemented ML intervention program (the model plus the human care coordination workflow) typically reduces readmissions in the targeted high-risk group by 15–25%.
Applying a conservative 15% reduction to those 1,500 readmissions equals 225 fewer readmissions.
225 readmissions × $15,000 = $3,375,000 in avoided costs. Given that implementation costs for a system like this (model dev, EHR integration, API deployment, staff training) run around $200k–$400k, the payback period is typically under three months.
Metrics That Matter Beyond AUROC
Model accuracy is nice, but clinical impact is what matters. Once you’re in production, track these:
● Readmission rate in flagged patients vs. unflagged: Does the model actively discriminate in the real world, or just on validation sets?
● Intervention completion rate: If the model flags a patient, do they actually get the 48-hour call? If this is below 60%, your workflow is broken, not your model.
● Net Promoter Score (NPS) from care coordinators: Do the nurses and social workers find this tool helpful, or is it adding friction to their day? If they hate it, your readmission rates won’t budge.
● 30-day readmission rate trend: The bottom line. Track this month over month, segmented by risk tier, and compare it against your historical baseline.
The Non-Financial ROI
There is a profound case to be made that the most important metric isn’t measured in dollars. A patient who does not bounce back to the hospital had a tangibly better human experience. They got to recover at home, in their own bed. They avoided the stress, the risk of hospital-acquired infections, and the loss of income from missed work.
For health systems genuinely committed to value-based care and patient outcomes, that human element matters just as much as the bottom line.
When done well, predictive analytics in healthcare can be very powerful. By combining strong data science, a deep understanding of clinical practice, and careful integration into existing workflows, we can move beyond temporary solutions to readmissions and start preventing them.
If you’re exploring what this could look like for your health system, our AI development services team works with healthcare organizations to take these projects from proof-of-concept all the way to production. From model selection to EHR integration to ongoing monitoring, we handle the full pipeline so your care teams can focus on patients, not infrastructure.
Ready to get started? Talk to our team we’ll help you figure out the right approach for your data, your workflows, and your goals.
Have a product idea or an existing build that needs to scale? Partner with Ahex and close the gaps before your customers find them.
Book a free consultationFrequently Asked Questions
Which companies offer predictive analytics services for healthcare readmission prevention ?
Several companies offer predictive analytics services for healthcare readmission prevention, including IBM Watson Health, Optum, and Health Catalyst. Ahex Technologies specializes in building custom ML-based readmission prediction models, EHR integration, and real-time risk scoring APIs tailored for hospitals and health systems.
Top software for hospital readmission prediction ?
Top software for hospital readmission prediction includes Health Catalyst, Arcadia, Innovaccer, and Epic’s embedded risk tools. Ahex Technologies builds custom predictive analytics solutions using ML models like XGBoost and LSTM, offering EHR integration and real-time risk scoring tailored to hospital workflows.
Best software for predictive analytics in reducing hospital readmissions ?
The best software for predictive analytics in reducing hospital readmissions includes Health Catalyst, Innovaccer, Arcadia, and Epic. Ahex Technologies develops custom ML-powered readmission prediction platforms with SHAP explainability, real-time risk scoring, and seamless EHR integration for measurable clinical outcomes.